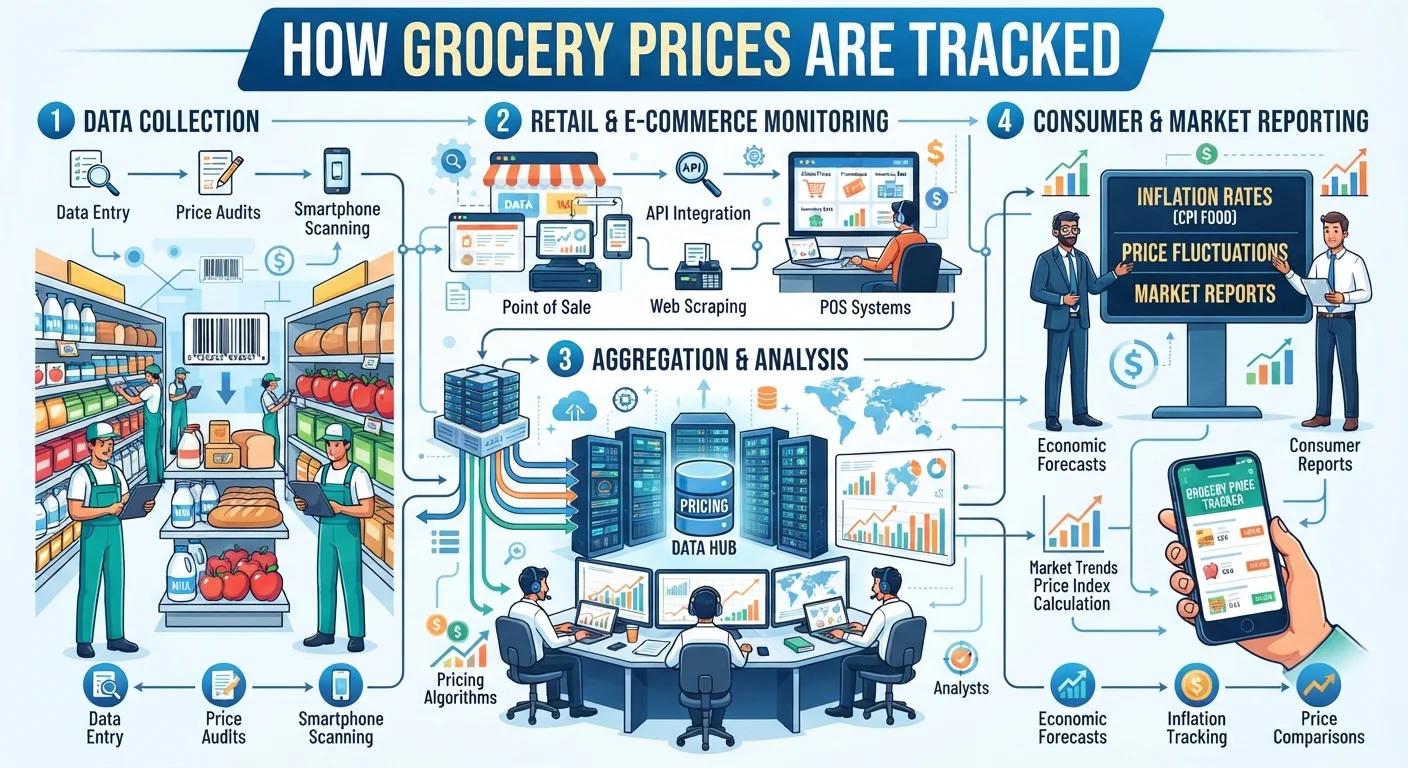
The Bureau of Labor Statistics splits food prices into two separate, closely watched categories within the Consumer Price Index: "food at home," covering grocery store and supermarket purchases, and "food away from home," covering restaurant and other foodservice purchases. As of July 2026, these two categories are telling genuinely different stories, with food-at-home prices up 2.7 percent over the prior year while food-away-from-home prices rose faster, 3.4 percent, over the same period.
This guide is independently written and is not affiliated with USDA, OPM, or the official federal Feds Feed Families campaign.
What the CPI Actually Measures
Food, shelter, and clothing together account for over 60 percent of the overall Consumer Price Index, reflecting a traditional weighting of the most essential household categories, and BLS reweighs these categories annually, with the most recent update taking place in December 2025 based on updated household spending patterns.
Why Food at Home and Away From Home Are Tracked Separately
- What the CPI Actually Measures
- Why Food at Home and Away From Home Are Tracked Separately
- How Individual Ingredient Categories Diverge
- Why "Core Inflation" Excludes Food
- Monthly vs. Annual Figures Tell Different Stories
- How This Data Connects to SNAP
- Where to Check Current Figures Yourself
- FAQ
- What's the difference between "food at home" and "food away from home" in CPI data?
- Are restaurant prices rising faster than grocery prices right now?
- Why does "Core Inflation" exclude food prices?
- Does grocery price data affect SNAP benefit amounts?
Splitting food into these two categories matters because they're driven by genuinely different cost pressures, grocery prices reflect farm-level commodity costs, transportation, and retail markup, while restaurant prices additionally reflect labor costs, rent, and service overhead. As of mid-2026, food-away-from-home prices have been running faster than their own historical average, 3.6 percent forecast for the year against a 20-year historical average of 3.5 percent, while food-at-home prices are actually forecast to rise more slowly than their own historical average, 2.5 percent against a 2.6 percent historical norm.
How Individual Ingredient Categories Diverge
Within the broader food-at-home category, USDA's Economic Research Service tracks 15 separate food categories, and price changes vary widely between them. In July 2026, retail fresh vegetable prices were 6.3 percent higher than a year earlier overall, but the specific breakdown showed fresh tomatoes up 12.8 percent, fresh lettuce up 7.5 percent, and fresh potatoes up a more modest 3.4 percent, illustrating how a single "vegetables" category headline can mask meaningfully different price movements for specific items a household actually buys.
Why "Core Inflation" Excludes Food
Economists and the Federal Reserve pay close attention to a measure called Core Inflation, which excludes both food and energy specifically because these categories tend to be more volatile month to month, driven by factors like weather and global commodity markets, potentially obscuring the underlying, more stable inflation trend the Fed uses to guide monetary policy. This is a genuinely important distinction for households to understand, since Core Inflation figures reported in the news don't reflect what's actually happening at the grocery checkout line.
Recommended Articles
 NEWS POLICY UPDATES
 NEWS POLICY UPDATES
 NEWS POLICY UPDATES
 NEWS POLICY UPDATES
Monthly vs. Annual Figures Tell Different Stories
BLS reports both a monthly change and a 12-month change for food prices, and these can diverge meaningfully: in July 2026, the food-at-home index was essentially unchanged from the prior month even while it remained 2.7 percent higher than the same month a year earlier, reflecting that most of that annual increase had already accumulated in earlier months of the year rather than happening in a single recent spike.
How This Data Connects to SNAP
The USDA's Thrifty Food Plan, which directly determines SNAP's maximum benefit amounts, is updated monthly using this same underlying CPI data, meaning the same price movements tracked in the broader Consumer Price Index for food directly feed into how much SNAP households can actually afford to buy from month to month.
Where to Check Current Figures Yourself
BLS publishes its full Consumer Price Index report monthly, typically in the second week of the following month, and USDA's Economic Research Service separately publishes a more detailed Food Price Outlook breaking down individual food categories, both of which are publicly available and updated on a predictable monthly schedule for anyone wanting to track current trends directly.
Read More Articals
FAQ
What's the difference between "food at home" and "food away from home" in CPI data?
Food at home covers grocery store and supermarket purchases, while food away from home covers restaurant and other foodservice purchases, and BLS tracks these as separate categories since they respond to different cost pressures.
Are restaurant prices rising faster than grocery prices right now?
Yes, as of July 2026. Food-away-from-home prices rose 3.4 percent over the prior year, faster than food-at-home prices, which rose 2.7 percent over the same period.
Why does "Core Inflation" exclude food prices?
Because food and energy prices tend to be more volatile month to month, driven by factors like weather and global commodity markets, which can obscure the more stable underlying inflation trend economists and the Federal Reserve are trying to track.
Does grocery price data affect SNAP benefit amounts?
Yes. USDA's Thrifty Food Plan, which directly determines SNAP's maximum benefit amounts, is updated monthly using this same underlying Consumer Price Index data.
Sources: U.S. Bureau of Labor Statistics July 2026 CPI report, USDA Economic Research Service Food Price Outlook.